Monday, April 20, 2020

Problems with the New Antibody Study from Santa Clara

I've been watching for results from various SARS-CoV-2 antibody testing projects with great interest, so I was interested to know that a Santa Clara County antibody survey just published interim results, here: https://www.medrxiv.org/…/10…/2020.04.14.20062463v1.full.pdf
I was extremely annoyed, however, on reading the results to find out that they recruited for their study using a Facebook ad! This makes their study population essentially self-selected and hence, in my view, practically worthless. I have no idea, either, how you would go about trying to correct for this self-selection bias.
The paper they cited as justification for this practice largely touted Facebook as a "cost effective" way of getting a mostly representative study population--which might be true if you're researching something for which the specific population whose size you are trying to gauge didn't have a vested interest in participating in your study in order to get a very hard-to-obtain and very sought after test. So yeah . . . "cost effective" except that they just wasted over 3000 perfectly good antibody tests on a study with a massive bias problem which we can't realistically quantify or correct for.

More Detailed Criticism

Imagine you are someone who had flu like symptoms a month or a few weeks ago. Now, like everyone in the world, you're wondering, "gee, was that really Covid-19? I bet I had Covid-19 and didn't even know it!" So if you see an ad on Facebook for a "hey, participate in this antibody testing study!", you are highly motivated to say "me! me! me! yes, test me!". On the other hand, if you have not had any flu like symptoms in the past two months, you are only motivated to take the study (which involves getting in your car and driving somewhere to get your blood drawn) if you understand the public health importance of figuring out how many asymptomatic cases there are. Which some people do, but a lot of people don't.

So by the design of the study, the population they are actually studying is probably much more representative of people in Santa Clara County who have had flu or cold symptoms recently than it is of people in Santa Clara County in general. And then of course you are going to way over-sample people who actually did have Covid-19 compared to the rest of the population. The claimed "50 to 85 times as many people" number is meaningless because of this oversampling.

Now, I admit, with something as high profile as Covid-19 antibody testing, it'll be hard to completely eliminate the self-selection bias--but it's not impossible. First of all, I would not use a Facebook ad campaign to recruit volunteers. I would use start with a home survey sent to a randomized set of addresses (as Dr. Streeck did in his antibody testing in the Gengelt). And I would not say in the survey that it was specifically for antibody testing, just that it was a study on Covid-19. 

Then I would follow up with an explanation: "OK, so now we would like to do antibody testing on you", and I would explain the importance to public health of getting as high of a participation rate as possible--really sell it hard and try to get everyone you selected to participate. This takes advantage of the existing attention capture, because it's a lot easier to get people to go along with something they've already partially bought into. And I really don't think it would be hard to get very high participation rates from a truly random sample if you approached it this way.

Can Self-Selection Bias be Corrected For?

If you start a study with a survey of a pre-selected set of randomized addresses, then you get to report on what percentage of people didn't participate in your survey. Which means you get to quantify the potential self-selection bias: something like, "since 30% of people chose not to take our test, we might have such-and-such percent selection bias."

The only way to do this with a Facebook ad campaign is to report on the total number of people who saw your ad but didn't click on it . . . which is kind of a dubious number given it's really hard to tell with internet ads how many people actually look at them or not. But the study didn't even report how many views the ad campaign got, or even how many people clicked on the ad, just the total number of people who filled out the initial online survey. So they're not even trying to quantify the massive self-selection bias. This is super shoddy, in my opinion.

How Bad Could the Effect of the Bias Be?

I did some simple calculations in a Google spreadsheet to try to quantify how bad a self-selection bias could be: https://docs.google.com/spreadsheets/d/1JfYxfak6uY4Bd1vBA-HGOYn_OECfGvrIp-H2ygPqn5M/edit?usp=sharing
The goal was to figure out how many different infection rates could actually match the results the Santa Clara study obtained. My question was this:

This study was reporting an interim result of an infection fatality rate for Santa Clara county of 0.12-0.2%. How big an effect would self-selection have to be in order for the true IFR to be actually 1%?

For this, you first have to decide on a percentage of people in Santa Clara county who might think, "hey, I might have had Covid-19 in the past two months". I first set this percentage at 20%, which I think is very generous considering the estimated total percentage of the population who gets the flu for the whole flu season is only 10%--I'm sort of adding in some people who had cold symptoms as well. It's a guestimate, let's go with it.

When you have this percentage, then you can start playing with a multiplier that represent how much more likely it is that people in that specific group of the population (people who have reason to suspect they might have had Covid) would respond to the Facebook ad campaign compared with people who have no reason to think they might have had Covid. The spreadsheet will then tell you how many people you would expect would test positive for Covid from the study under those assumptions. You then need to adjust your numbers till it matches the number of people from the study that actually tested positive for Covid (50), and that will tell you what the self-selecting bias needs to have been.

In order to achieve a target IFR of 1% (around 10 times the study number), and assuming that a full 20% of all people in Santa Clara had reason to believe they had Covid for some reason (again, I feel that very generous), then I need these people to be 4.6 times more likely to respond to the Facebook ad than people who have no reason to suspect they had Covid. I think it's entirely reasonable to think that people who think they might have had Covid would be up to 5 times more likely to respond to such a survey.

If I decrease my 20% estimate and say instead that just 5% of all people in Santa Clara had some reason to think they had Covid earlier, then I only need these people to be 2.9 times more likely to respond to the Facebook ad in order to get the 50 positive tests the study obtained.

Interestingly, after going through this exercise, I think this does open up a way that the self-selection bias could be a least partially detected. The study took a survey of the respondents, and I assume they asked some basic questions including whether they had any cold or flu symptoms in the past few months--although the preliminary report does not say that they took this sort of survey information, so maybe I'm assuming too much. But assuming they did, they could compare the percentage of respondents reporting previous symptoms with the percentage of the general population who actually had undiagnosed flu-like illnesses. This should track with a self-selection bias, I think.

Postscript

After I went through my own analysis, I discovered that a peer reviewer of this study has come to some similar conclusions: https://medium.com/@balajis/peer-review-of-covid-19-antibody-seroprevalence-in-santa-clara-county-california-1f6382258c25.  He doesn't do a sensitivity analysis of the same sort that I do, but he does also have a different concern based off of the false positive percentage of the test used as well.  The review is worth reading.
Thursday, April 16, 2020

Explaining Shifting Covid-19 Fatality Rates

People have been confused about the wide estimates of the fatality of Covid-19.  At one point, the WHO issued an estimate to the effect that 3.8% of people infected by Covid-19 would die.  At one point, it looked like Italy was having more than a 10% fatality rate.  Later, we've heard a lot of people say something to the effect that Covid-19 is "10 times deadlier than the flu", which works out to be something like a 1% fatality rate.  Quite recently, a preliminary report on a serological antibody survey in Germany stated that the true fatality rate in this region works out to be only 0.37%

So why do we see these shifting, very different death estimates?  Why is this hard to pin down?  The number we are trying to establish here is the Case Fatality Rate, or CFR, and it's defined very simply as the number of deaths from a disease divided by the total number of people who have that disease: if 100 people get a disease and 10 of them die, that's a CFR of 10%.  The math is a simple division, so what makes this hard to determine?

It turns out that there are two primary sources of uncertainty in calculating a CFR:

  • Uncertainty in knowing how many people actually have the disease (the denominator of the percent).
  • A timeline specific uncertainty in knowing how many deaths will occur (the numerator of the percent) that happens if you are trying to calculate a CFR in the middle of an epidemic. 

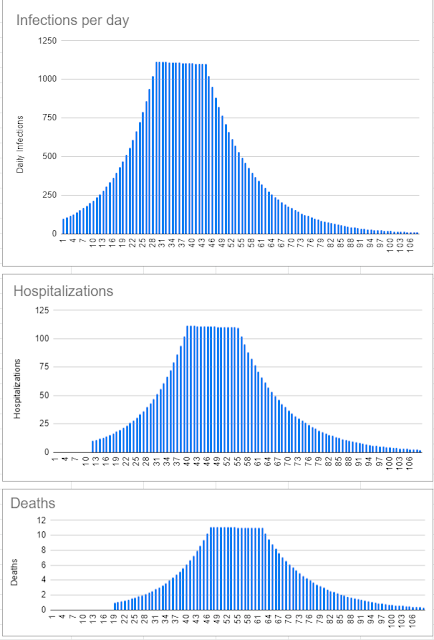
I wanted to try to illustrate both of these problems with estimating the fatality rate for a new disease, so I came up with some scenarios and graphs that demonstrate them.  You can look at all the numbers I came up with for this scenario on this google spreadsheet: https://docs.google.com/spreadsheets/d/1ePV5OnN5xeHYmXyzxbpccYUrxPnffTeU6_YtFOYmiLU/edit?usp=sharing

The Disease Timeline


The first thing I did was to generate some numbers in a spreadsheet for an infection in a location that behaves roughly as we have seen Covid-19 behave.  My model for the infection curve that I generated was roughly South Korea, as it has the most complete data for a rise-and-fall of the disease so far.  I generated about 3 1/2 months of infections-per-day numbers that rise exponentially for the first 30 days, then abruptly level off due to interventions, and then decay rather rapidly after a time.  Then I assumed that some percentage of people with the disease would require hospitalization (10% is the amount I chose), but that on average, people wouldn't need hospitalization until they'd been infected for 10 days.  Then I assumed that some percentage of people who were hospitalized (again, 10% is what I chose) would die, on an average of 7 days after hospitalization.  This gives a total real-life CFR of 1%.  It also give us three graphs which show the same curve shape, but scaled down and shifted in time for the hospitalizations and again for the deaths.


(The curve shapes are pretty terrible because I don't know how to do logistic curves in Google Spreadsheets, but this is fine to get the point across.)

What is the Apparent CFR?


With this timeline established, I then asked the question: given this disease progression timeline, what would the CFR appear to be at any given moment?  At any moment, if the people in this scenario stopped to tally up all the deaths that had occurred so far and divide that by all the infections they knew about, what would they think the CFR was?

And the answer to this is, it depends on what infections they know about.

So let's look at three different scenarios:

  1. Poor knowledge of infections
  2. Consistently good knowledge of infections
  3. Perfect knowledge of infections.
In all three scenarios, we are going to assume that we know about all infections that become hospitalized, so these people always get counted in with the known infected.  How many non-hospitalized infected are known is what varies for each scenario.

In the first scenario, we are going to assume that our sample nation was unprepared and did almost no testing in the general population until some amount of people started dying: call this the "Italian Paradigm".  Even after testing starts, it ramps up slowly, only reaching full capacity by the end of the outbreak. 

Furthermore, we are going to assume that there is a large body of infected people who have no symptoms and who never get tested--say, half of all the infected people.  So in the "poor knowledge" scenario, the testing for non-hospitalized cases starts near zero and only goes up to a bit above 40% of total coverage at the best.

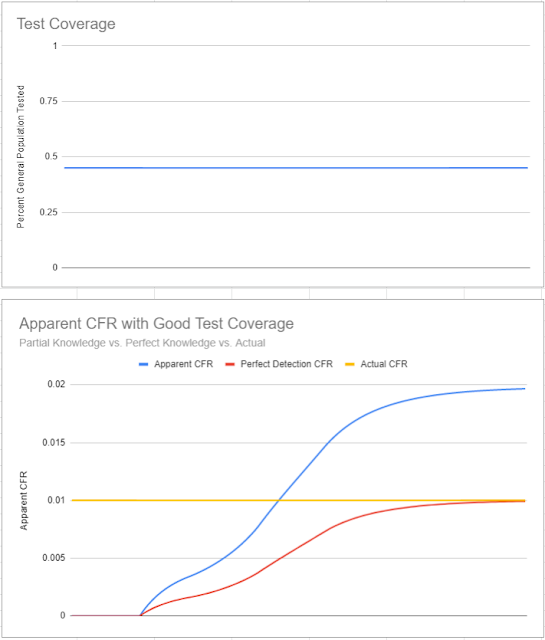
In the second scenario, we are going to assume that the sample nation was prepared and jumped on testing right away: call this the "South Korean" paradigm.  Here we are going to assume a constant high rate of testing that catches most symptomatic infected people.  However, we are still going to assume a large body of infected people who are asymptomatic who never get tested.  So for this scenario, we are saying that 45% of all infected people outside of the hospital system are known about, as well as all the people within it.

In the third scenario, we are going to assume that we somehow magically know all of the infected people right away.

I generated the numbers of known infected people per day given these knowledge restrictions, for each scenario.  Then a calculated what the apparent CFR would look like if it was calculated each day by taking the sum of deaths so far and dividing it by the sum of these known infected.  Here's what I got:

Poor Knowledge of non-Hospital Infections


What we see here is that due to the lack of good knowledge of how many non-hospitalized infections there are, the apparent CFR almost immediately jumps up to an artificially high number.  Given no extra-hospital testing, this would eventually rise to 10%, which is the fatality rate I chose for infections that get to the hospitalization stage.  Once some testing starts to kick in, though, the number starts to go down, as knowledge of total infected starts to get better.  However, while this does happen, more people continue to die, and this effect starts taking over and the apparent CFR starts rising again.  It finally rests at a number 6 times what it should be, which indicates that while all deaths are counted by the end, only 1/6th of the total infected were ever counted.

I am also plotting on this chart (for comparison purposes) the third scenario, where we magically know all infections at all time: this is the red line on the graph.  Note that even with perfect knowledge, due to the time lag of when people die, this also gives an incorrect apparent CFR up until the very end.

Consistently Good Knowledge of non-Hospital Infections


Here we see that due to prompt testing, we don't see an initial spike of the apparent CFR to unrealistic levels dominated by the death rate in hospitals.  Instead, though, we see an initial underestimation of CFR, and this is due to the time lag in deaths.  This, in my opinion, matches very well with the evolution of CFR that we saw in places like South Korea and Germany, where there was an initial very low CFR estimate that has been creeping up over time.  I think both places had pretty good testing in place before the epidemic began to take off (South Korea more so than Germany, but I think both did pretty well).

This is an important context in order to understand the 0.37% CFR that Dr. Streeck recently reported.  It needs to be understood that this number would correspond to a point on the red line on this graph: a point at which all deaths so far are known, and also all infections (statistically in this case due to a serological study).  If you look at where Germany as a whole is on the curve at the time Dr. Streeck reported his conclusion, I think you will see that it matches in this scenario at a point in time a little past the 1/3rd mark--the point shortly after interventions are starting to flatten the curve.

This means we should not be surprised to see the CFR in Germany increase over time above Dr. Streeck's preliminary report.  Doubling or even tripling would not surprise me.

Conclusion

Attempting to evaluate the CFR of a disease while it is in mid-progression is fraught with problems.  I have demonstrated only two of the problems with this very over-simplified model.  Therefore, the best projections of disease fatality do not use this kind of simplistic logic.  If you want to see the more sophisticated way in which these things are done, I encourage you to look at the disease severity study which the Imperial College study used, which I discussed in this blog post earlier: https://darkenedintellect.blogspot.com/2020/03/the-imperial-college-study-part-3a.html .

Monday, April 13, 2020

Are the lockdowns responsible for declines in infection growth?

Recently, infection and death rates in Europe and the United States appear to be leveling off and even dropping.  Since this was the point of the massive social distancing measures the whole industrialized world has been taking, the natural interpretation of this would be: the measures we took are working and we are beginning to see the results.

However, some people have claimed that the leveling off of deaths is not due to strict isolation measures, but something the disease was going to do anyway.  What we are seeing, this theory claims, is a natural peak in the disease.  Lockdown measures may have slightly reduced the total number of deaths, but the behavior of the curve was going to follow the current path we are seeing anyway, more or less.  The clear implication of this theory, if it is correct, is that we should end the strict social distancing measures and the disease will dwindle away on its own.

Can we determine which interpretation of the facts fits best?  I think we can, fairly simply.

What the Prevailing Theory Expects

Given the theory that the disease will act in the standard way in which one expects an epidemic to act, what we should see is that the infection grows exponentially at first, but then rapidly shifts its growth rates after social distancing measures are put into place, in every place in which these measures are enacted.  We can visualize this infection curve using an online pandemic calculator, available here: http://gabgoh.github.io/COVID/index.html

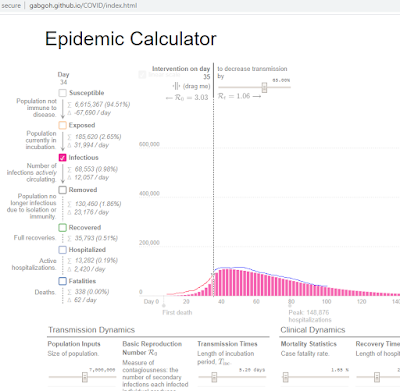
To model our scenario, I have put in a disease with an R(0) of 3.  This is midway between earlier estimates of Covid-19's R(0), which was around 2.4, with later estimates which have put it as high as 3.87.  Then I set an intervention date about a month into the course of the disease which has the effect of reducing the R(0) to around 1: the threshold below which a disease will begin to die out.  Here's what that looked like:


Note that the resulting curve is composed of two curves, which I've marked in red and in blue.  On the left of the intervention, there is a standard exponential curve, concave up.  Right at the point of the intervention, it rapidly switches to concave down.  It still rises for a bit, but it has a shallow hump which then trails off gradually afterwards.

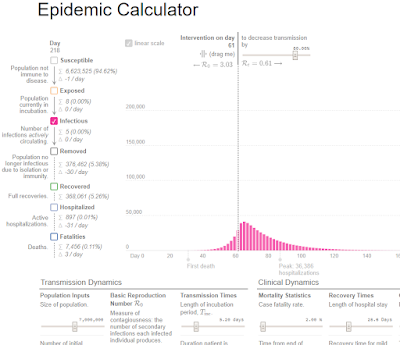
The exact shape of the right-hand side of the curve depends a lot on what you set the R(0) to be after the intervention.  Depending on how effective your intervention strategy is, the daily infections can die off either rather steeply, or rather slowly.  I've heard, for example, an estimation of current, post-lockdown R(0) being put at 0.62.  This is what the pandemic calculator looks like with that number instead:


I encourage my readers to go to this site and play around with the numbers yourself--if nothing else, this should cause you to have better sympathy for the shifting numbers coming from the IHME projections, because you will quickly see that small changes to the R(0) (which is the degree to which people are spreading the virus around) can have quite large changes to the final infected number.

What's Actually Happening

So now let's look at reality instead of this model.  Do we see this same sort of results in those countries that have had significant outbreaks, and then initiated strict societal interventions in order to flatten the curve?

In order to look at this, we'll pick some countries from the Worldometer site.  In order not to have our results confused by poor testing (which has been a problem in many countries), we are going to look at daily death rates rather than daily infection rates.  This curve should be the same shape as the daily infected curve, just smaller and with some time lag, since only a fraction of infected will die and since it takes time for people to progress from having the infection to dying.

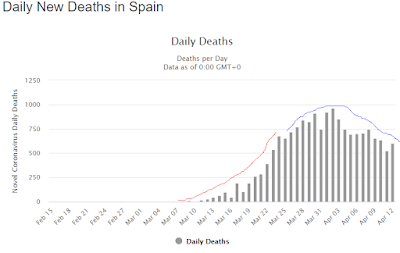
Here is Spain's daily death chart:

You can see clearly the exponential growth on the left side and a clear, abrupt transition to a smoothly curved peak and gradual decay on the right.  The date of the transition appears to be somewhere around March 24th.


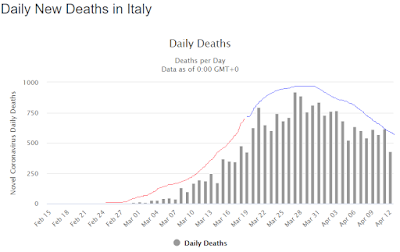
Here's Italy's chart:


Again, we can clearly see exponential growth on the left abruptly transitioning to a shallow hump and gradual decline to the right.

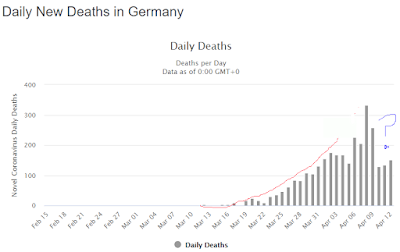
What about Germany?  In this case, the shape is less clear:
In this case, the exponential growth on the left is obvious, but it's not so obvious what's happening on the right.  Here we should realize that Germany's curve starts later than Spain's and Italy's.  The pandemic apparently reached Germany later than it did Italy and Spain, so we're not seeing the peak and trail-off yet in the death rates.  However, let's cheat with Germany and look at the daily infection rates chart--we should be able to see the effects of lockdown earlier with these numbers because of the time lag between infection and death.  Germany has been doing a lot better in testing than a lot of other countries, so maybe we can trust that their infection rate numbers are fairly reliable:

Nice!  It actually looks just like a continued form of the deaths chart from above.  More evidence, I think, that Germany's testing has been far more representative of actual infection rates than other countries' has been.

What about South Korea?  Here we have a problem that South Korea has been so on top of the pandemic, from the very beginning, that their daily death rate chart doesn't have enough data to form a recognizable curve: they just haven't had enough people die.  This is excellent, but it does mean we can't use their chart for this analysis.  However, since their epidemic control has been driven by extensive testing, we can probably do what we did for Germany and use their daily infection rates, again probably with a good degree of confidence:


OK, the smaller dataset does make the curve more patchy, but it still fits pretty well: concave up on the left and a trail-off on the right.  It does appear to me that the drop-off on the right for South Korea is more dramatic than the trail-offs we've been seeing in Europe.  This would fit with their lower overall death rate, though: the fact is, South Korea has simply had a better handle on the epidemic from the beginning.

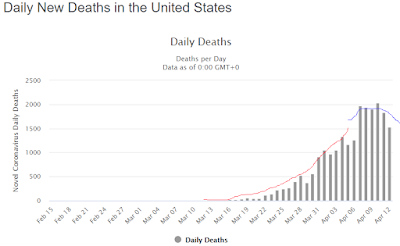
So lastly, how is the United States doing?  First, it should be pointed out that, as opposed to all of the countries we've listed so far, the United States hasn't had one set of lockdown measures.  Different states implemented different lockdown measures at different time.  We should expect to see a bit of overlapping curve flattening from the time periods when different states were probably experiencing different disease growth rates.  Second, the United States is clearly behind Italy and Spain in the pandemic timeline, so we're likely to have small amounts of data for the right side of the curve.  Those caveats being given, here's what we see:

Fits pretty well, I'd say, given the caveats above.  Given the massive testing problems the U.S. had early on, I'm reluctant to use the daily infection rate curve, but given that our testing has been better recently, maybe we can get a better sense at least of what the right side of the curve looks like?

Still unclear, I'd say; we're still too early on.  However, it certainly doesn't invalidate the theory; I'd say it weakly confirms it.

Timeline of the Inflection Points

Now that we've seen that the shape of the curves we see in real life are matching quite well with the predicted curves for the standard theory, can we also ask the question, does the timing of the curve flattening correspond with the lockdowns?  Different countries imposed societal lockdowns at different times; if they are what is responsible for the curve flattening, we should expect to see some correlation in the timelines.

For the nations that we have looked at so far, here is a table showing the dates for which those countries imposed a nation-wide lockdown (or in South Korea's case, a nation-wide banning of large public gatherings), side-by-side with the dates at which I am seeing an inflection curve in their charts:

Lockdown ImposedDate of Inflection
South Korea  Feb. 21stFeb. 27th (for infections)
ItalyMarch 9thMarch 19th
SpainMarch 14thMarch 24th
GermanyMarch 22ndApril 2nd
United States  March 22nd (New York)        ~April 4th

To me, this timeline is compelling; I don't see how anyone could look at this data and not conclude that we are seeing the results of societal changes in the infection and death rates at this point.

The Alternative Theory: The Disease is Peaking by Itself

However, let's suppose the above is not found to be convincing.  What about the alternative theory?  What would we expect to see if the disease is playing itself out, without social distancing being a major factor in the decline of the disease? 

You can see what a standard epidemic disease curve looks like by using the epidemic calculator (making the intervention meaningless by setting the post-intervention R(0) to the same as the pre-intervention R(0)):


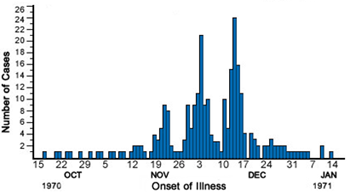
Notice that the left and right hand sides of the curve are symmetrical: it declines as rapidly as it attacks, once the population has been saturated.  This shape does show up in real-life as well; we see this sort of shape in uncontrolled epidemics all the time.  Here's an example graph from some '70s measles outbreaks, for example:

This outbreak came in a rapid sequence of waves (measles is *extremely* infectious), which had a roughly symmetrical look to them.  Here's another example which is a collection of epidemic curves from the SARS outbreak:

https://www.who.int/csr/sars/epicurve/epiindex/en/

Here I notice that the right hand side of the curve in these charts is typically as steep to decline or steeper than is the left hand attack portion of the curve.

I find the lack of "spikiness" of the real data we are seeing difficult to square with how epidemics of very infectious diseases look like.  I don't know how proponents of this theory explain an exponential attack and a much less exponential decay.

Total Infection Counts

The real problem with this theory, though, is the total infection counts, as a percentage of the population.  If the real factor in limiting the continued growth of the disease were that it was reaching inherent limits of the population and herd immunity were kicking in, then each nation should see roughly the same total percentage of their population infected by the end.  Herd immunity works by a certain percentage of the population becoming immune, thus crippling the disease's ability to spread rapidly.

So what sort of total infection percentages are we looking at here?

South Korea has a population of 52 million people.  They have had 217 deaths so far, and their curve is completely flattened.  That's a total death rate of 0.0004% of the population.

Italy has a population of about 60 million people.  They're not done with their curve yet, but they've had 20,000 deaths so far . . . maybe we'll guess 25,000 deaths before the curve fully flattens.  That's a total death rate of 0.042% of the population.  That's over 100 times as many people as a percentage of their population than South Korea.

Spain has a population of about 47 million people.  They're also not done with their curve yet, but they look on track to total maybe about 20,000 deaths.  That's a total death rate of 0.043% . . . very similar to Italy's.

Germany has a population of about 83 million people.  They're even further behind in the timeline than Spain and Italy, but with only 3000 deaths so far, maybe we can project a full doubling and say 6000 total deaths by the time of curve flattening.  That's a total death rate of 0.0072% of the population.  This is less than 1/5th of the total numbers Italy and Spain are going towards, but more than 15 times the number South Korea is going to end up with.

The United States has a population of about 327 million people.  Again, we're back in the timeline a bit too far to project accurately, but applying the same logic as I did with Germany, we'd end up with a total of around 45,000 deaths  (I know 60,000 or so is the current best estimate, but I'm just trying to be consistent with what I did for Germany).  This would work out to a total death rate of 0.014%, which would put us somewhere in between Germany on the one hand and Spain and Italy on the other hand for total percentage infected.

These numbers are all impossible to explain by the theory that the disease is simply spreading naturally and hitting its natural peak due to herd immunity building in all the countries of the world in which it is spreading.  Why should South Korea hit that natural peak 100 times faster than Italy did?  Why should Germany hit that peak 15 times faster than Italy but only twice as fast as the United States?

Conclusion

The conclusion here is quite clear: Covid-19 is currently being limited by drastic social distancing measures (in the case of most of the world) or a combination of early testing and case management plus less drastic social distancing measures (in the case of South Korea and some others).  There is no way for naturally acquired herd immunity to explain the current decrease in rates of infection and death that we are seeing, but it is easy to explain this using the standard, accepted theory of the disease spread.  The highly different percentages of the total population that will die is therefore strictly due to the difference in promptness which these different nations implemented effective disease control measures.