Wednesday, March 2, 2022

Key Points You Need to Know When Talking About Energy: Alternating Current and Grid Instability

In this installment, I'll discuss a major element of grid instability that is not commonly understood, which is frequency instability.  Frequency is a much more critical aspect of the electric grid than most people realize.  To understand why, you need to understand roughly how AC power is transmitted.

AC Power transmission: No electricity is produced

One aspect in which the standard "water analogy" of electricity fails is that by this analogy, one would expect that power plants pump electrons into transmission wires, which then flow down to substations, are split up and then pour into homes when needed.  In fact, however, AC power generation results in a net-zero motion of electrons.  The alternating current does move electrons back and forth a bit, but there is no round trip of electrons moving around a circuit.  This is what the "alternating" part of "Alternating Current" means: charge flows one way very briefly (1/120th of a second in North America), but then flows right back the other direction, cancelling out the previous flow of charge.  The total electrical charge delivered from all power stations to the grid over time is exactly zero.

If power stations don't deliver electricity to the grid, how do they deliver power?  The answer is that they deliver cyclical changes to the electrical potential of the grid components.  You can think of this as a constant back-and-forth motion in the electrical field that can be harnessed by any electrical tool that keys off of this cyclical motion.  Incandescent light bulbs, for example, run simply off of resistance, which is electrical friction.  Just as when you are attempting to start a fire by rubbing two sticks together, the heat that is generated doesn't care what direction the sticks are going, so too you can hook an incandescent light bulb straight up to either an AC power source or a DC power source and it will work exactly the same way.  On the other hand, things like computers and cell phones rely on actual directional electricity flow because they make use of electrical logic gates, which do very much care about the direction of energy flow.  This is why such devices need the AC adaptor--that bulky "wall wart" to which the charge cord going into the phone or laptop; this is the electrical equivalent of a "worm gear," changing cyclical energy into linear energy.

My current favorite explanation of this phenomenon is this YouTube video by Veritasium: The Big Misconception About Electricity.  His analogy of AC power transmission as being a chain inside a tube being pushed back and forth is an excellent way of understanding things on a basic level (though he himself qualifies this analogy pretty severely in the above video.)  It's a cool video and I recommend you watch the whole thing, but for efficiency's sake I have linked to the precise moment in the video where he begins to talk about AC power transmission, and you only need to watch about 2 minutes of the video from that point.  (The details about wire transmission versus electrical field transmission are interesting from a physics perspective, but not really relevant to energy policy.)

AC Power transmission: No electricity is stored

To the above point, I will add also the fact that there is, currently, no real utility scale storage in the power grid.  This is no longer *strictly* true, as there are (as mentioned before) now "utility scale" battery storage plants in the world which do store energy and release it to the grid.  However, all such power storage plants combined have a negligible impact on the grid.  They currently amount to less than a rounding error in the total energy scheme of things.

One interesting consequence of this is that as you look at anything around you that is consuming electrical energy, you can know that (since electrical power travels over the grid at about the speed of light) the power that is lighting that lightbulb or driving that computer monitor was--less than a millisecond ago!--a scalding hot bit of steam pushing a steam turbine, or a photon hitting a solar cell, or a puff of wind pushing a wind turbine.  Electricity delivery from power plant to home happens quasi-immediately--that is, at the speed of light.

Frequency synchronization

So AC power transmission happens (basically) immediately and also cyclically; in North America, the back-and-forth of alternating current on the grid happens at 60 Hertz (cycles per second).  These two facts together means that all power plants putting energy onto the grid must be synchronized.  Every input into the grid *must* be at a frequency matched with the grid frequency.  As the electrical fields are going back and forth on the grid, if some power source attempted to add energy into the system but was pushing while everyone else was pulling, it would instead *remove* energy from the system: it would cancel out instead of adding.

Actually, "cancelling out" is not a good description of what would happen in such a case, since the actual result would be much more violent.  If you have ever driven a stick shift, you have probably at least once accidentally put the vehicle into reverse when you meant to put it into a forward gear.  Remember the gear grinding?  That's getting closer to what would happen if a power plant tried to put electricity onto a grid with the wrong frequency.  Except, that's not a violent enough image for what would happen.  There are *massive* amounts of energy involved here.  Let me come up with a better analogy:

Suppose you were to take a lawn mower, turn it on, and then keep it running while upside down.  Then if  you took another lawn mower, turn it on and put it on top of that lawn mower--imagine the wreck and metallic carnage that would ensue. 

Then imagine doing that, but instead of using lawn mowers, use two of those massive turbines that are in power plants:


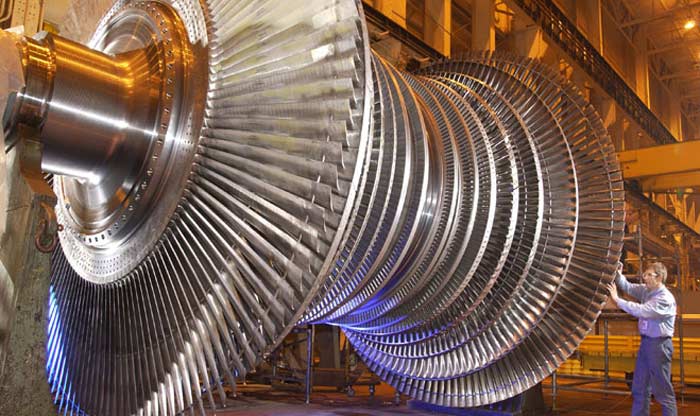
Two turbines connected to the same grid but operating at different frequencies would result in enormous destruction.  Massive, expensive pieces of machinery connected to one or the other or both would tear themselves apart due to the conflicting magnetic forces that situation would create.  Explosions, sparks flying, massive crank shafts breaking apart . . . well, it would be bad, let's say that much.

This is why all utility scale equipment have trip-safeties built in.  We are familiar with *current* circuit breakers, which break the circuit in case too much electricity is flowing because of overload or a short circuit.  Utility equipment, on the other hand, have *frequency* circuit breakers.  In the event that a generator detects that it is producing electricity at a frequency too far off the grid frequency, the equipment will automatically trip, removing itself from the grid.

The relationship between frequency and power

There are a number of issues that can affect the frequency of a power plant, the most usual one being excessive load.  This is something that bicyclists will be familiar with, actually.  If you are cycling along a flat road, pedaling at a specific rate, but then hit an uphill slope, you will find it very difficult to maintain the same speed.  Normally, the rate at which you push the pedals around will naturally slow down.  The same thing happens to power plants when they experience higher than normal load: frequency goes down as power output is too low to meet demand.

While this is good from the standpoint of equipment safety, it does create an inherent danger in the grid of cascading failures.  Suppose, as was the case last year in Texas, that you have a systemic problem affecting power output in many power plants across the grid.  Supply cannot quite keep up with demand.  Consequently, some power plants start to have trouble keeping up with the required grid frequency.  Once some of these plants start removing themselves from the grid due to frequency issues, however, this puts even more burden on the remaining plants.  What can happen, then is a cascading failure where, all of a sudden, all power plants across the grid trip, one after another.

Most people are unaware of how close to this total failure Texas came last year.  (Here's a decent video talking about this: What Really Happened During the Texas Power Grid Outage?).  Texas was 4 minute 37 seconds away from triggering this sort of cascading failure.  If power managers had not managed demand by "shedding load" (i.e., turning off power to large segments of the grid), the entire grid in Texas would have gone black.

And "going black" is worse than you probably realize, again because of synchronization.  Turning power plants back on and getting a grid back up to fully operational is a massive task, because every power plant must be carefully brought back online *in sychronization* with every other power plant.  Such a "cold black start" in Texas has never happened, but is projected to take weeks or months to finish, during which time almost the entire State of Texas would have been without electricity.

Implications for the energy debates

Let's draw a few implications for energy policy from the above discussion:

  1. Variable power sources have inherent grid stability problems.  Because of the relationship between power balance and frequency, power sources which dramatically change their power output are inherently tricky to manage on the grid.  It's not just a question of whether you have the total raw power at any moment to keep up with your demand; you have to do this *and* at the same time keep all of your separate power sources properly magnetically coupled, lest everything come crashing down.  The greater the extent your grid relies on such fluctuating power sources, the more of a challenge this becomes.
  2. Some people have criticized Texas for not connecting to the wider grid, evidently thinking that the more power plants are linked to a system, the more secure the system will be.  That is not necessarily the case.  More power plants magnetically coupled does mean more total power, but it *also* means more plants that must be precisely aligned with each other.  It's been shown that more interconnections (beyond a certain limit) will tend to *de*-stabilize the grid, not increase reliability.

    This is why for some of the largest interconnections between grid areas, you will see high-voltage DC powerlines connecting grid to grid.  You convert from AC to DC at one end, pipe the electricity to the other end, and then convert back to AC.  This provides a power pipeline from one grid to the other without entangling the two systems with the same frequency requirements.

    However, such high-voltage DC power lines are a modern, specialized, high-tech, and extremely expensive solution.  Most such power lines are rather short and limited to high-density areas, because they are so expensive to create.  The most obvious consequence of this is that any infrastructure bill that doles out money to individual regions and tells them "improve your grid infrastructure" is not going to result in such power lines.  These things are always created as specific projects in order to connect grid-to-grid: no single region is going to be able to justify high voltage DC power lines *for the purpose of that region alone*.
  3. Frequency instability is a major reason why the supposed "Smart Grid" is still very much a pie-in-the-sky idea.  The idea that a power grid can be made stable and usable even with widely varying power inputs by having all of the nodes in the grid be intelligently switchable is nice--but completely beyond any existing grid right now.  The extent of "Smart Grid" technology available right now is really all about dynamic load shedding--smart meters that turn down your AC on a hot summer day because the grid load is getting too high.  The ability of a Smart Grid to dynamically handle variable *power plant* loads is only possible via the addition of massive, currently non-existent machinery: intelligently connected synchronizing relays, or something to that effect.

    Again, a key takeaway here is that no amount of *normal* funding from an infrastructure bill which is aimed at "repairing our crumbling infrastructure" (or whatever the rhetoric is) will allow for this sort of transformation of the power grid into something that can handle huge amounts of variable power supply.  What would be needed for such a thing is a radical transformation, not just a repair.


Key Points You Need to Know When Talking About Energy: Power vs. Energy

I'm going to start this series by going over some very basic fundamentals of energy production, distribution, and consumption.  The goal here is to highlight those facts which are most important in order to be an intelligent consumer of energy news and an intelligent participant in energy debates.

Power vs. Energy

I don't think I should waste time by offering yet another explanation of electrical terms such as current, voltage and resistance, since these explanations are available in many forms across the internet.  If you need a refresher on what those terms mean, I recommend searching on the terms "electricity" and "water analogy".  The water analogy is not perfect, but it's a standard and it's good way to keep these things straight in your head.  Here is one such explanation I found among many: 


What I would like to particularly point out, however, is the distinction between Power and Energy.  To quote the above site:

POWER is like the volume of water that is flowing from the hose, given a specific pressure and diameter. Electric power is measured in watts (W). And larger systems are measured in kilowatts (1 KW = 1000 watts) or megawatts (1 MW = 1,000,000 watts).

ENERGY is like measuring the volume of water that has flowed through the hose over a period of time, like filling a 5 gallon bucket in a minute. Electric energy is often confused with electric power but they are two different things – power measures capacity and energy measures delivery. Electric energy is measured in watt hours (wh) but most people are more familiar with the measurement on their electric bills, kilowatt hours (1 kWh = 1,000 watt hours). Electric utilities work at a larger scale and will commonly use megawatt hours (1 MWh = 1,000 kWh).

Because I think this distinction is important, I'll add a supplementary example to illustrate the difference between power and energy.  Consider: how would a Lamborghini perform as a way to haul a heavy trailer across country, say for a move?  In terms of raw horsepower, I'm sure the sports car has the capability of moving even heavy loads (if you could figure out a way to attach the trailer to the car in a way which the forces involved don't rip the car apart).  But, for how long could the sports car keep this up?  Because the sports car is designed in such a way as to maximize power output for relatively brief periods of acceleration, it does not produce this power efficiently--it guzzles gas for maximum acceleration output.  Further, in order to minimize weight, these sports cars all have tiny gas tanks.  The amount of energy that these types of car produce on any given full tank of gas, is therefore pretty small.  In order to haul a trailer across country, you'd have to be constantly stopping at gas stations along the way to fill up. There are some stretches of road in the States in which it is doubtful that a sports car could actually make it between gas stations.

Therefore, high power does not equate to high energy.

Why this matters

Now, there is a specific reason why this distinction is critical to keep in mind when reading news reports or arguments on energy, specifically regarding renewable energy sources.  It is a constant bad habit of people reporting on energy stories or talking about energy problems, that they frequently report on the *power* component of a power station and not the *energy capacity* component.  The specific thing to watch out for is: does a news story report electrical generation in megawatts (MW), or in megawatt-hours (MWh)?  Far too many people use the former when they should be using the latter.

For example, I have seen articles claiming that such-and-such percentage of electricity production in a certain location comes from renewables.  Diving into the data myself, I have found that these numbers are frequently produced by adding up the "nameplate" capacity of all the powerplants of a particular type and comparing them.  These values are reported in a number of easily available sites; for example, here's a list of powerplants in Texas which is available on Wikipedia: List of Power Stations in Texas

The problem with this is that the nameplate capacity for a powerplant is its *maximum power output* at any given time.  It does not represent the energy per hour that the plant should be expected to produce.  For more traditional power plants, this wasn't such a critical distinction, as most of these plants operate pretty continuously, and so you can compare energy output of these plants mostly based off of their maximum rated continuous capacity.  That is, a 2000MW coal plant will probably produce about as much energy as a 2000MW oil plant (though even here some major caveats will apply).

This is not at all the case, however, with wind and solar plants, which are only rarely able to operate at nameplate capacity; even the *average* output can vary pretty severely, but something like 1/4 or 1/3 of maximum output is often about right to get to real energy produced.  Many analyses which look at relative amounts of energy produced by renewable vs. non-renewable sources therefore drastically overstate the amount of actual energy being produced by renewables because of the confusion between power and energy capacity.

How this applies to energy storage

This same confusion also causes dramatic overestimates of the sufficiency of current utility-scale battery backup.

For example, the current largest utility-scale battery power plant is the Moss Landing Battery Storage project in California.  This power plant has a nameplate capacity of 400MW.  If you look at the list of wind power plants in Texas from the above Wikipedia link, you'll see that the average power capacity of these plants is about 280MW.  Does this mean that the Moss Landing plant could replace about 1.5 wind power plants?  No.  The *energy* capacity of Mass Landing is only 1600MWh.  This means that *if* the plant starts at full charge, it is only able to produce its 400MW to the grid for a period of 4 hours before it is completely drained of energy.

This is, in fact very much like the Lamborghini example above.  Technically, the power plant does have the power to replace a wind plant for a while, but planning on using it to replace wind power on a regular basis is highly optimistic given its total capacity.

Conclusion

The bottom line here is, if you see a news story or argument about energy production that purports to show percentage of production or consumption, be sure that you double-check the units.  If the argument is based on megawatts instead of megawatt hours (as many are), chances are that the author is fundamentally misunderstanding the problem at hand and is looking at the wrong values.

Saturday, February 12, 2022

Some wrong ways to think about abusing priests

Way back in the early '90's, I attended a community college in Northern California.  During the course of studies there, I attended a "health consciousness" talk given by a guest lecturer: a gay man talking about living with AIDS.  When he told us his life story, he mentioned (almost in passing) that he had been a seminarian at a Catholic seminary for a while, and had seriously considered continuing on to become a priest before he ultimately to leave.

During the Q&A portion of the lecture, an incredulous student asked him about that: "why on earth would an active gay man want to be in a Catholic seminary, given the Church's stance on homosexuality?"

The way he answered the question was very illuminating for me, and it has stuck with me over the years.  As he answered the question, I realized that he was perfectly sincere, and that the reasons he listed that made him consider staying in the seminary and becoming a priest where--in at least some sense--good reasons.  He mentioned some aspects of spirituality he was attracted to--but the biggest reason that weighed on his mind was the respect of his friends and family.  He was still "in the closet" at the time, and he mentioned that his parents were already suspicious that he had never had a girlfriend.  Becoming a priest would have meant having a permanent excuse for this; it would have meant never having to disappoint his parents, and turning their suspicion, shame, and possible condemnation into pride and joy.

This is a very "good" reason for a closeted gay man to want to become a priest--"good" in the sense of powerful and cogent rather than in the sense of "worthy".  Looking at the thing from his perspective, it was an attractive prospect.  Ultimately, he decided that this would be lying to himself, so he left the seminary and starting living openly with his boyfriend instead.

The lesson that I drew from this is that the reasons that any particular person may have to join an organization or to seek a position do not necessarily relate to the natural purpose of that organization or that position.  You can't assume that because someone wants to be a teacher, he therefore loves teaching; he might simply love being in a position of authority over weaker and vulnerable people.  You can't assume that because a person wants to be a policeman that he loves justice; he might come from a line of policemen and want to fit in with his family history.

Pedophile priests: guilty until proven innocent?

This is all context that I wanted to setup for my main purpose: which is to (partially) evaluate this online article: Are priests guilty until proven innocent?

In this article, Eric Sammons raises some legitimate points about the rush to condemn a priest, Fr. James Jackson, FSSP, who has been accused of a sexual crime.  At least at the time of the publication of that article, the news-consuming public had little in the way of concrete information about this evidence behind these accusations, so I think it was certainly appropriate to caution against rash judgment. And I do not intend to challenge this primary point.

However, along the way towards cautioning against rash judgment, Mr. Sammons has made some dangerous errors which I believe ought to be corrected.  I would like to look at two related errors, both of which are contained in this sentence from the article:

Yet being slow to believe that a beloved priest—who is beloved precisely because he publicly adheres faithfully to Catholic doctrine—is guilty of such crimes is natural. After all, if a Catholic didn’t think being faithful to the Church gives at least some help to avoid committing such actions, why bother being Catholic? If you believe that Fr. Jackson is a faithful priest, you should find it hard to believe he did these things.

These are the two types of errors Mr. Sammons is committing in this statement, as I see them:

I. How easily we should believe that a priest has fallen into this type of sin.

It may seem logical and even necessary that the holiness of the priesthood should predispose us to doubt that a priest could be capable of such infamous sins.  But there are two problems with this logic:

1. Grace and the life of Faith do not work like magic incantations.  

Going through the physical motions of prayer and the Sacramental life do nothing good for your soul if you are not properly interiorly disposed to receive the graces of the Sacraments.  In fact, it is the opposite.  St. Paul says of people who receive the Sacraments unworthily:
Whoever, therefore, eats the bread or drinks the cup of the Lord in an unworthy manner will be guilty of profaning the body and blood of the Lord. Let a man examine himself, and so eat of the bread and drink of the cup. For any one who eats and drinks without discerning the body eats and drinks judgment upon himself. That is why many of you are weak and ill, and some have died. (1 Cor 11: 28-30)

Grace and the gifts of the Sacraments are awesome, incredible things--but they are not safe.  This is why we prohibit those people in mortal sin from approaching the Sacraments (aside from Penance)--it's not because we are afraid of sullying the purity of Our Lord (who indeed plunged Himself into crowds of sinners).  It is because without repentance, the Sacraments are perilously dangerous to those who dare to grasp them unworthily.

So what should we expect, theoretically, for a priest who has joined the priesthood while hiding from his spiritual directors a sexual aberration such as arousal from viewing children?  Should we expect that a man who has dared to put himself forward as an alter Christus in order to hide a shameful sin from the world, will receive "at least some help to avoid committing such actions"?  No.  This is not a reasonable expectation.

Now, Mr. Sammons did couch his statement in the terms "If you believe that Fr. Jackson is a faithful priest", which would preclude the scenario that I just brought up.  But this is, quite simply, to beg the question.  How do you know that someone is, in fact, a faithful priest? (More on this a bit later).

2. Pedophilia is not just a vice to be worked on; it is a deep-seated psychological problem.

To hold, as Mr. Sammons is, that priests in general, should be less prone to fall into these types of scandalous sin because they are living a life designed to make one more holy is to fundamentally misunderstand the developmental order of these types of sexual deviancy.  It is not as if it is typical for a person to join the priesthood as an adult and only afterwards to start becoming tempted by deviant sexual thoughts.  In fact, it is pretty much universally the case for people who have these kinds of psycho-sexual disturbances, that they are clearly present already at least by the early post-pubescent years.  Very commonly, the roots of the problem can be found even earlier, often caused by some kind of childhood abuse.

Whether or not a priest will fall into these sorts of sin, then, depends not nearly so much on what sort of life he was living as a priest, but rather on the conditions that existed already when he was admitted into the seminary as a candidate.  There are really no circumstances I can think of in which it is a reasonable decision for a person to seek the priesthood if he knows he is subject to pedophiliac tendencies, nor would it be a reasonable decision at all for a seminary to accept such a candidate if such a serious sexual issue is known.

Therefore, when a priest falls into such a sin, it is no use looking at the purported sincerity or faithfulness of that person's life as a priest.  More than likely, the whole thing was built up on a lie: a foundation of sand rather than stone.  We should expect such a thing to come crashing down.

So then the question becomes, how much should Catholics expect that people with such fundamental sexual issues would seek to become priests and successfully accomplish it?  And here, I return to the story with which I started this post: there are "good," cogent reasons for such people to seek out the priesthood.  Even more so than homosexuality, pedophilia is an extremely shameful fault, and those who are unfortunate to have it get very good at hiding it, sometimes even from themselves. Furthermore, pedophiles--almost universally--have great difficulty in establishing normal romantic relationships with adults, and will therefore naturally see a life of honored celibacy as a relief to their discomfort and a cover for their shame.

It is also a well known fact that pedophiles seek out positions of trust in order to gain access to children.  This phenomenon is not restricted to the priesthood, by any means!  The one pedophile I know best personally, for example, set up shop as a family counselor at one point.   Schools must be vigilant about this, too, because pedophiles tend to seek out positions as teachers.  Single mothers looking to date also need to be vigilant about this, for the same reason: their children are an unfortunate attractor for a certain type of person.

To think, therefore, that "the priesthood is a holy institution, and therefore we can typically expect people who achieve it to be more holy" is to completely misunderstand the problem.  It is a holy institution, but in its accidents, it has some other properties as well which make it an attractive goal for people for whom holiness is not the first objective. 

I'd like to note also, that this error is the mirror image of an error often made by those of a liberal or anti-Traditionalist persuasion, which is to think that these sorts of sexual abuses by priests are due to the life of celibacy.  Again, this is to miss the real problem, which is how these people came to become priests in the first place.  I don't know of a single incident where it can be plausibly held that a priest started without sexual desires towards children, but then developed such a taste after too much time in poorly tolerated celibacy.  These sexual deviancies develop too early in life for that to ever really be the case.

II. How can a man who does [x] good thing, also be unfaithful?


Mr. Sammon's second major error is encapsulated in the first sentence: "being slow to believe that a beloved priest—who is beloved precisely because he publicly adheres faithfully to Catholic doctrine—is guilty of such crimes is natural".  The error here is to equate external adherence to the formal intellectual teachings of the Catholic faith with actual faithfulness, as in adherence of the mind and will to Christ.

Here is what is important to understand: not only is the Catholic Faith true, it is also (in the technical theological meaning) glorious.  Glory--understood as a theological concept--refers to all of those things that radiate out from the fundamental goodness and beauty of a thing.  The Catholic Faith is the saving doctrine revealed by God to man, and that is what is fundamental about it, but there are many, many, things about the Catholic faith that are beautiful to behold in addition to that.  Catholicism has a 2000 year history of glorious culture, brilliant philosophy, and attractive heroic lives.  It is a family in which one may find friendship and comfort, a school in which one may be taught the deepest truths, and a political institution which can inspire the most loyal fealty.

In other words--and this is the important part--you do not need to be a truly faithful Catholic in order to be enthusiastic about Catholicism.  You can understand and even preach enthusiastically about Catholic dogma merely from an appreciation of its impressive intellectual consistency or its aesthetic beauty.

It is therefore a very dangerous thing to simply assume from outward consistency of teaching with the dogmas of the faith, that a person is therefore a holy person, or a "faithful priest", in the truest meaning of the word "faithful".

This error, I think, is especially dangerous because it can not only blind us in truly evaluating a priest's true moral character, but it is also an easy way by which conservative Catholics can deceive themselves.  Am I a good Catholic, we ask?  There are a lot of ways to answer this question that dodge around the true way of answering this, which is to ask: "Am I really striving to do my Lord's will every moment of every day?" 

Here are some common ways of answering this question that are really false shortcuts: "Do I love traditional Catholic liturgy?"  "Am I loyal to the Bishops that teach orthodoxy?"  "Do I proudly and loudly reject modern errors?"  "Do I identify as a Traditionalist?" Etc.

None of these things get to the heart of true Fidelity, which is a life that cleaves to Christ with as much will as it is given the Grace to have.

Conclusion

It is (very fortunately!) not usually the job of most of us to evaluate whether a priest accused of sexual sins is guilty or innocent, or even if it is likely that a priest is guilty or innocent.  Most of the time, on this basis, we should maintain a healthy skepticism about the guilt or innocence of a particular priest who has fallen into scandal.  This has, unfortunately, been made more difficult for the lay Catholic, who nowadays feels the burden of making these kinds of judgement in the absence of the truly responsible parties doing a good job of making them--we feel the need to hold our Bishops' feet to the fire on this topic, lest more abusing priests be allowed to continue in their abuse.  

To the extent, however, that it is our moral responsibility to evaluate the possibility that a particular priest is guilty of sins of this sort, I believe it is very important to avoid falling into certain intellectual traps.  Do not think that the holiness of the state itself will act as some sort of magical repellant that will deter sinful men from seeking the priesthood--almost the opposite is the case.  Likewise, do not make the mistake of confusing intellectual adherence to a system of doctrine with true faithfulness to Christ.  This is not true even of our own interior lives, let alone the lives of preachers who get respect and even reverence for their orthodoxy.

For those who have the care of keeping safe the flock of Christ, perpetual vigilance is therefore necessary.

Sunday, October 10, 2021

Projected Risks and Benefits of Increased Vaccination Rates

The United States is currently debating, and in some cases, implementing a series of different Covid-19 vaccine mandates.  Passions are rather high on the topic; I thought that it would be a good idea to attempt to quantify the expected health risks and benefits associated with greatly increasing the rates of vaccination in the country prior to the winter.  I take it for granted that health is not the only good to be considered overall, and considerations of liberty and self-determination are also at play.  But here, I am just trying to isolate and quantify the public health aspect of the question alone, in the service of people trying to find the right prudential balance.

The Risks

Supposing you were to forcibly vaccinate every remaining unvaccinated person in the country, excepting those people with valid medical reasons for an exemption (such as a history of severe allergic reactions to vaccination, etc.).  What would be the downside?

Vaccines are not perfectly safe, and vaccinating a large number of people will inevitably have side effects, up to and including the death of some people.  Here, I am going to estimate the number of deaths only, and not attempt to quantify the amount of detriment to health that severe but non-lethal side effects will have.  I will do the same thing for the health effects of Covid on the other side of the scales.  The reasoning behind this is that a lot of different kinds of health problems tend to behave very similarly in this way: that the severity of outcomes occur in a natural distribution curve.  That is, a small number of people will die, a larger number of people will have severe but non-lethal outcomes, and the largest number of people will have moderate to mild outcomes.  

Given that distributions of outcomes tend to be shaped like a normal distribution curve of some type, it is often the case that comparing just the most easily measured of a possible range of outcomes will still give a valid comparison, rather than laboriously comparing most serious to most serious, least to least, and so forth.  And for both vaccinations and disease, deaths are the least ambiguous outcome and one where we are most sure of the numbers.  So that's why I'm going to compare just death rate to death rate, as a proxy for the entire health burden of vaccination versus disease.

So how many deaths would one expect from a massive vaccination campaign of about 124 million people (about the number of people remaining to be vaccinated)?  Well, I know of three real and dangerous side-effects that have been seen from the vaccines: anaphylactic shock (a complication possible from any vaccine), myocarditis, mostly seen from the mRNA vaccines, and a rare type of blood clotting in women seen from the adenovirus vaccines.

Anaphylaxis

Incidence of anaphylaxis post-vaccination are pretty rare (about 3-5 per 1 million doses), and given that anaphylaxis is normally very treatable with on-site application of steroids, I have struggled to find any cases of deaths from anaphylaxis verifiably caused by the vaccine.  I did find reports of one in India, one in England, and one in Vietnam, so I believe it *does* happen.  I think it would be hard to justify a death rate of anything higher than 1 death per 10 million people vaccinated, though, so let's very pessimistically put this number at 12 people dead from anaphylactic shock.

Myocarditis

Incidences of myocarditis from the vaccines are rare enough, but since the myocarditis is also generally a pretty mild form when it does happen, deaths are even rarer.  No person in the United States has been found to have died from myocarditis post-vaccination so far, out of about 200 million people vaccinated.  Europe has seen 5 people die from myocarditis or pericarditis after about 200 million people were vaccinated, but it's unsure if all of those were actually related to vaccination or were coincidental.  So a good number here is probably something like 1 per every 100 million people vaccinated.  For our scenario, let's round that up to 2 people dead.

Blood Clots

For the unique form of blood clotting associated with the adenovirus vaccines, the incidence of deaths is higher.  Three people in the United States have been verified to have died from blood clots caused by the Johnson & Johnson vaccine.  Death rates in other places where usage of adenovirus vaccines are much more prevalent have been estimated at 7 per million people vaccinated.  Thus far, only 8% of Americans have been vaccinated with the Johnson & Johnson vaccine . . . and I have to think that this percentage would *have* to decrease, especially among those women who are most susceptible to this kind of blood clotting.  In fact, I would suspect that doctors would strongly urge women in the susceptible groups to get the mRNA vaccines instead, of which we have more than plenty supply for everybody.

So I'm going to assume that the J&J vaccine accounts for only 4% of the total vaccinations in our hypothetical campaign, which would then work out to it causing something like 35 deaths.

Other Unknown Causes

It's difficult to account for the pure unknown.  In this case, I find there is little need to do so.  Statistics has methods of characterizing when a sample of a certain population is sufficient to give you statistical certainty that you are going to have a representative result from that sample.  And those methods are all *entirely pointless here*, because the number of people to be vaccinated in this theoretical vaccination campaign is *smaller than the total number of people already vaccinated*--the "statistical sample" is larger than the rest of the population.

I don't know if there is a word for statistical "super significance", but the data we already have from vaccinating a majority of the population should classify for that if anything does.

There is no reason to believe at this point that any new surprises are going to arise from a new massive vaccination campaign.  But hey! let's imagine something comes up anyway.  We will arbitrarily double the number of projected deaths we have come up with so far, adding another 49 deaths from some mystery side effect--let's say something that effects small children only maybe.

Final Range

Now let's take the number we have come up with, and multiply it by 2 for a fudge factor--maybe all of the deaths we have looked at so far have only caught 50% of the true deaths caused by vaccination, for some reason I can't right now imagine.  Then let's round up, and we have a total of 200 deaths caused by this vaccination campaign.  This is probably an absurd number, as it is already arbitrarily quadrupled over a number that was already unrealistically pessimistic.  But let's go with it for now as an upper bound, or the pessimistic side of our projection.

What's the optimistic side of this projection?  Well, the total number of confirmed deaths from Covid vaccines so far in the United States is 3.  Those were all from the J&J vaccine, and it's reasonable to think that if you are vaccinating a smaller group of people and you just avoid giving the J&J vaccine to vulnerable women, then nobody will die.  Further, it is thought that now that we understand that this rare blood clotting is a risk, we understand also the warning symptoms that proceed the stroke it causes.  It's possible that none of those three people would have died if doctors had known what to do and had taken preventative action that is now on the standard warning label for the J&J vaccine.

So it's quite reasonable to think that the total death toll of vaccinating 124 million people would be exactly zero.

Consequently, the final range for deaths caused by vaccination we can project to be something between 0 and 200 people.

Benefits

Now, what are the benefits of this massive vaccination campaign?  To answer that question, we would have to know how many people we expect to die if nothing special is done and people just continue to be vaccinated by choice, slowly (currently happening at the rate of about 500,000 people per day).  Keeping in mind that vaccination takes 6 weeks to reach full effect, the current rate of vaccination will only reach about 15 million people before it's too late to do any good for this winter season--*if* the current rates hold up, which I find doubtful since we are currently "burning through" the only-somewhat-hesitant crowd.  That's only about 10% of the total people you could vaccinate--probably not enough to make a substantial difference in the total illness and death.

This is a very difficult thing to estimate, full of different kinds of uncertainty.  I'm going to try several different ways of estimating and compare the results of these different approaches.

Summer to Winter Comparison

In 2020, there was a summer surge in infections and deaths, followed by a winter surge in infections and death.  Importantly, the social restrictions in place between those two time periods were largely the same, and the levels of vaccination were the same in both cases: effectively zero, as vaccinations didn't start having a real population-level effect until after the primary winter season was over.

In 2021, we have also had a summer surge, and it is inevitable that we will also have a winter surge.  The social restrictions in place between the two surges will be the same, I assume: effectively nothing.  Likewise, the total level of vaccinations will be roughly the same--new vaccination rates having dwindled to their lowest numbers ever just before the summer surge and having only just sluggishly risen to their current tepid numbers now as we are near the end of it.  There will be about a 10-15% increase in meaningful vaccinations at the start of the winter surge compared to the start of the summer surge, but that will be only a second order effect on the total numbers (probably, more on this later).

So here is one reasonable approach to estimate the number of people who will die this winter from Covid: take the ratio of the number of people who died from Covid in the winter compared to the summer of 2020, and multiply the number of people who have died from Covid in the summer of 2021 by that ratio.  Then, make some adjustment for the increased levels of vaccination: say, subtract 20% to account for the 15% increase in vaccination levels.  The result will be the projected number of people who will die this winter.

I've done this in a spreadsheet here: Winter Death Estimates.  The result that this gives you is about 450,000 deaths projected for this winter.

Percentage of the Remaining Vulnerable

I think 450,000 is extremely pessimistic, so let's try a different approach.  Let's try thinking about how many people are even left to infect, and how many of those people might plausibly fall sick this coming winter season.

The reason I think the previous number is pessimistic is that if you start calculating up the total number of people who have been either previously infected or vaccinated, you start to come up with large percentages of the population--things like 88%.  This is very close to levels where we could consider herd immunity in play.  If we actually reach an effective herd immunity, then R levels could drop below 1.0 and we could have close to *zero* spread of the disease this winter--that is somewhat plausible.

Now, figuring how close we are to herd immunity this is an inexact science for several reasons, of which there are three primary ones.  

The first primary reasons is that there is always a large body of people who are infected but not diagnosed--the asymptomatic majority.  What the proportion is between the known infections and these unknown infections, however, is still a matter of some conjecture.  Something like 50% to 75% of the total Covid infections are these "occult" infections, and since you don't know that number, you don't know how much immunity is really out there.  

The second major source of uncertainty here is that we don't know for sure how much existing immunity--either from previous infections or from older vaccinations--is going to prevent spread of the virus this coming winter.  Both older vaccinations and older infections may hold up well to prevent serious illness and death in those who have them--but as for holding up for preventing spread of the disease, that is far less certain.

Finally, herd immunity doesn't work as well in a fragmented society.  If there are large populations of people who are less vaccinated than other people *and* they spend a lot of time in close proximity to each other (say, for example, school children), then it won't matter if the population as a whole has a high rate of immunization, the disease will still be able to spread robustly through that proportion of the population which is less vaccinated.  So, overall vaccination numbers don't tell you the whole story as far as limits on disease spread.

*But* let's attempt to do this calculation anyway.  The population of the United States and the number of vaccinated people are easy numbers to obtain, as is the number of individuals who have recovered from diagnosed Covid.  To calculate the remaining vulnerable people, you have to assume a certain ratio of diagnosed Covid to non-diagnosed Covid, and the lower that ratio, the more vulnerable people are still around.

Beyond that, you have to determine what you think the attack rate this coming winter will be: what percentage of vulnerable people will come down with the disease.  This is an extremely difficult question to settle.  Given that the Delta variant is about twice as infective as original covid, with an R0 of 5-6, traditional models for infectious diseases gives you a very high mark for what the final attack rate will be--anything above 3 and the final attack rate is typically reckoned in the mid-to-high 90's.  But you can't just take Delta's R0 since one assumes that, first of all, not all people who could possibly get sick from Covid eventually will actually get sick precisely this winter, and secondly, that the interference of large amounts of immune people will have *some* oppressive effect on spread, and hence final attack rate.

The Range

In the absence of far too much information, I have put as an upper-end-of-plausibility an attack rate of 75%.  For reference, the attack rate of just the 2020 winter season was about 3% of the total population, so this rate is *remarkably* higher than what we have ever seen in a season before.  The fact that we will be seeing a holiday season for the first time, however, both with a very infectious version of Covid very much about *and* no social distancing to speak of, makes this attack rate maybe not entirely fantastical.

So by taking 75% of the remaining vulnerable population as a worst-case estimate, and maximizing the size of the remaining population by *minimizing* the number of people who are already immune, I come to a maximum death rate for this winter of 672,000 people.

On the lower end, I assumed a higher number of existing immune people, and assumed an attack rate of  1.5%, which is assuming that the disease spreads half as vigorously among the remaining vulnerable than it did among the vulnerable from last winter (probably an extremely questionable assumption given how robustly it has spread during this summer, but let's go with it).  These assumptions lead to a projected maximum death rate of only about 3000 people.

This is, to say the least, an extremely broad range of possibilities.

Equalizing Death Rates

The final method of coming up with a winter death rate is as follows:

We know that Covid is capable of killing up to 3297 people for every million persons in a population.  We know this, because that is currently the total death rate for the State in the union that currently has the highest number (Mississippi).  Now, when people look to explain why Mississippi and other states have had their death rate totals be so high, they normally have been looking to its comparatively low vaccination rates compared to other states.  That, however, is an over simplification.  In fact, while Mississippi *has* had a lower vaccination rate than other states, it's not all *that* much lower.  Meanwhile, Florida *also* had an extremely bad summer and has ended with a very high death rate, and *its* vaccination rates overall weren't bad.

The real reason behind these high death rates is not the overall vaccination rates.  Rather, because Covid spreads among interconnected network of vulnerable people, the high death rates in the states that have suffered them this summer has been primarily due to large numbers of unvaccinated people *living in close communities* with each other.  Primarily we are talking here about close-knit black and Hispanic communities with low vaccination rates.

So then the next realization you can have is that, when Thanksgiving and Christmas come around *everyone* becomes a close connected community.  This is a major--perhaps *the* major--reason why these seasons are replete with illness.  Consequently, one could expect that when the holiday season comes, all of the other States will be vulnerable to disease spread among the unvaccinated in the same way that the other States already had disease spread among the unvaccinated.  Unvaccinated people who were previously unconnected because there were not living in close community with other unvaccinated people will all of a sudden be spending time, cheek by jowl, with each other over the holidays.

The hypothesis then is, take the current highest death rate among the States (3297 people per million of population), and assume that all of the other States will rise to equal that level over the holidays as unconnected unvaccinated become connected.

This will probably *underestimate* the death rates because it will assume that nobody will rise *above* that existing death rate (and I'm sure that more people will die from Mississippi, making that assumption untrue).  But it also probably *overestimates* the death rates because there are a number of states that are *way* beneath that level and seem unlikely to go that far in a season.  But let's assume that the over and under estimates somehow balance each other out and see what we get.

This calculation is also on the spreadsheet, and it comes out to about 365,000 deaths.

Final Calculation of Benefits

The final calculation of the benefits of a massive vaccination campaign, in terms of lives saved, is therefore a number of extremely broad range.  The vaccines have been holding up in terms of preventing death from Covid at something around the 95% rate, so you only need to adjust those final death numbers down a little bit to get total lives saved.  In reality, if you did somehow manage to vaccinate *all* the eligible people, you'd save more than 95% of the potential lives, since you'd *seriously* cut into infections as well as prevent deaths.  Actual prevention of death would probably rise to something closer to 99% of the people who would have otherwise died.  But let's be pessimistic again at call it just 90% of people saved.  

In calculating the final range of people who might possibly die, I also refuse to consider the 672,000 figure from the "Remaining Vulnerable" method.  I don't know what's actually wrong with that calculation, but instinct tells me that it is not plausible.  So I'm only going to use 3000 for the bottom range and 450,000 for the top range.  Taking 90% of that tells me that the projected benefit of an extremely aggressive vaccination campaign getting close to 100% of eligible people before winter could result in between 2,700 and 400,000 lives saved.

Risks vs. Benefits

Is this analysis worth anything?  With such a wide range of possible outcomes, is there any take-away action we can recommend?  That is beyond the scope of this post, but I will point out two things:

  1. The risks of extremely aggressive vaccination at its most pessimistic is more than an order of magnitude less than the benefits at *its* most pessimistic.  There is therefore no realistic scenario, at all, in which an extremely aggressive vaccination program will not provide more benefit than harm, at least at the level of physical health.

  2. The range of possible outcomes is for projected deaths this winter is extremely broad, but I think definitely realistic.  I would be greatly shocked if deaths this winter were less than 3000 people, and I would be shocked if they exceeded 450,000 people. 

    And this means, I think, that numbers in the middle range are very appropriate projections for a State to plan for.  I think that 100-200,000 is a very realistic possibility, though I'm very hopeful that the number will be closer to 20-50,000.  In general, if there are very few downsides (which we have shown is true, comparatively), the State *ought* to plan for the worst.  So I would advocate for a way of thinking in which we assume that 100-200,000 deaths will happen this winter if we do nothing.

Wednesday, September 22, 2021

Dying "with" vs. Dying "from" Covid, pt. 3

One issue with the previous analysis is that it applies only to deaths that were purely coincidental to Covid infections.  Another set of deaths, it might be argued, that overly inflate the total death toll of Covid are those deaths in which Covid did, in fact, act as the proximate cause, but which were deaths of very weak or sickly old people who were probably going to die anyway--in a matter of days, weeks, or months.

For these deaths, the timing issue would not arise.  In fact, these deaths would technically still be attributable to Covid, since it was Covid that, so to speak, pushed these people over the edge.  So the previous analysis would not be able to separate out these deaths from other Covid deaths, whereas really the deaths *should* be more attributed to the extreme age or weakness of the people who died.

I don't think there's any question that deaths of this kind occurred and were included in the official Covid tally.  Can we get some sort of estimate, however, on the magnitude of this effect?

Average Death Rates

Here, it is good to look at the average yearly death rates.  In the United States, these vary from year to year, but not by a whole lot.  They are also relatively constant throughout the year aside from a yearly noticeable peak during flu season.

Given the relative stability of this yearly average death rate in the U.S., we should be able to eliminate at least some of these types of deaths of the extremely weak.  The hypothesis is that these people would have died soon anyway without Covid, and it just happened to be Covid that was the last straw.  If this were the case, then we should see that these deaths, though included in the official Covid death tally, would *not* have increased the total deaths that occurred in the year above the yearly average.  In other words, suppose 300,000 people are supposed to have died from Covid in 2020, but half of those people were people who were most likely going to die that year anyway.  We should then expect the total number of deaths from all causes in 2020 to have risen above the average only by 150,000, not by 300,000.

This analysis has been done (and continues to be done) by the CDC on an ongoing basis.  The report may be found here:


Currently, the CDC is estimating that since Covid began, we have had an average of about 760,000 excess deaths above what is statistically expected given recent history.  Meanwhile, the official Covid death count is only at about 620,000 (for the time period at which the CDC data on that page was most recently updated).  This means that there seems to be an *excess* of deaths resulting from Covid, *above* what the official tally reveals--something on the order of 20% or so.

Other Analyses

The CDC is not alone in coming to this conclusion.  The Wall Street Journal has done several excellent statistical analyses of  U.S. and world data on excess deaths more than once and has come to similar conclusions (though with slightly higher estimates for the underreporting of Covid-19 deaths at 35%):


Yet other statistical analyses have put the toll even higher: Estimation of excess mortality due to COVID-19 by the IHME puts the real toll of Covid in the U.S. at about 57% higher than the official tally based on excess deaths.

What Explains the Extra Deaths?

So why would there be more deaths from Covid than actually reported?  The first explanation some people might want to gravitate towards is: social measures taken to halt Covid have had bad side effects on the population.  For example, people who *should* have gone to the hospital with a heart condition were afraid to and hence died at home rather than being treated as they would otherwise have been.

The problem with this theory is that if you look at the graph of excess deaths, they very clearly track exactly with Covid infections--as Covid cases go up, the excess deaths go up, and as they go down, the excess deaths go down.  The excess deaths do *not* track with the rigor of societal restrictions, which were most strict in the very earliest phase of the pandemic, but eased off before the Summer '20 surge and were even more eased just before the disastrous Fall / Winter '20 season.  

Therefore plausible reasons to explain these excess deaths have to find a cause that's correlated with Covid infections.  I have three theories that I would like to propose:

  1. In regions in which medical resources became strained due to Covid outbreaks, care of other patients suffered as well due to total lack of resources.

  2. Many people who died from Covid were the elderly, in nursing homes, and with other comorbidities.  It's quite possible that many of those people died in such a way that their comorbidities were blamed rather than Covid, but that their deaths would not have happened for more than a year without Covid.  (My opinion is that this represents the bulk of the difference between official tally and actual death toll).

  3. As I have pointed out several times, Covid has a significant second method of killing people, which is attacking the heart.  We know for sure that Covid is to blame for at least a few heart attacks that otherwise came out of the blue, even in people who were otherwise only very mildly sick from Covid or even completely asymptomatic.  Myocarditis has been found associated with Covid in otherwise healthy people who were asymptomatic at extremely high rates: up to 25% in one study of athletes with Covid.

    It is quite possible that a number of people over the past year have dropped dead from heart attacks directly caused by Covid, but without that cause ever having been discovered.  In fact, I believe we have some indirect evidence of this in studies which have shown that reports of heart attacks have inexplicitly risen in regions with high Covid occurrences.

What Do these Excess Deaths Mean?

That large number of deaths have indubitably occurred since Covid began and have been rising and falling largely in step with the rise and fall of Covid infections makes it exceedingly difficult for the theory that the official death tally for Covid is an overstatement.  It makes it essentially impossible to claim that most of these people who died were on death's door already.  To continue to maintain that the official death tally is a gross overstatement requires some other explanation, which I have not yet heard and which I can't even imagine currently.

This does not mean, however, that the death tally can't be put into a certain amount of perspective.  While the people who died were certainly not all on death's door, nevertheless most of them have been quite old and vulnerable in other ways.  It *is* quite possible that many and possibly the majority of them had only 3-5 years left anyway, or maybe 10 at the outside.  Given the age of the primary victims of Covid, this is something that is necessarily true.

If you wanted to be morbidly precise and weigh out everyone's life in a balance, then it is possible to take the age and comorbidity statistics that we have and figure out what the approximate toll of Covid has been in terms of total man-years of life lost.  This would certainly be a legitimate way to minimize the impact of Covid, though a rather ghoulish one, in my opinion.

If you were to do that, however, it would only then be fair to add into the balance the serious illness as well.  There are many vulnerable people who were sickened by Covid and did *not* die, but nevertheless were left with significant, long lasting recoveries and put into a permanently weakened state: weaker heart, shredded lungs.  These people are not counted yet on Covid's death toll, but have *certainly* lost total years of their life due to their battle with Covid.  This will be a harder toll to add up than just the people who died, but *if* you go down the route of counting years of life lost, then you certainly need to add those future lost years in as well.

Conclusion

It is not possible to maintain that the official death toll for Covid is vastly overstated.  By virtue of coincidental deaths, it might be as much as 10% overstated, but by virtue of excess deaths we observe, it is very likely to be something like 20% *under*-stated.  It *is* true that the majority of these deaths were elderly or otherwise vulnerable people, and you can make of that fact what you want based on how much value you place on the lives of the elderly.


Dying "with" vs. Dying "from" Covid, pt. 2

For the first method of data analysis, I note that the official Covid death tally is surmised to be composed of two series of numbers: the people each day who die of some random cause but only happen to be infected with Covid, and the people each day who actually die of Covid.  And *both* of these series of numbers will be related to another series of numbers: the number of people each day who are diagnosed with Covid.  However, the two types of people who die each day will each have  a *different* relationship to this number.

For the people who die of some other completely unrelated cause, the number of those people--who just happen to also have Covid--will be directly related to how many people currently have Covid in the population.  If a lot of people happen to have Covid at some time, a lot of people who die *at that time* will also happen to have Covid by coincidence.  If few people happen to have Covid at that time, few people will die coincidentally also having Covid.  So if you plotted the number of people who have Covid at any particular time on the same graph as the number of people who die "with" Covid at any particular time, the second graph will be a mirror of the first graph (but smaller).

The same thing is true of people who die "from" Covid--*except* for the important fact that this graph would be not only mirrored, but also time shifted.  It takes some time after you are diagnosed with Covid to actually die of Covid.  So if a lot of people at a particular time are diagnosed with Covid, then *later on* a lot of people will die from Covid--but not right away.

This time dependency represents a difference between the two types of people that we are surmising compose the total official death tally of Covid.  We should then be able to separate out roughly how many people fall into each category by doing a time-dependent analysis.

My Analysis

Here was my approach, using publicly available datasets and a custom Python program:

I assumed that the number of "deaths with" (the coincidental deaths) included in the official death tally was some fairly constant percentage of the total deaths (seeing as I couldn't think of any good reason for this to change over time).  I also assumed that the number of these deaths over time would be directly proportional to the number of Covid cases at the time.  I could therefore generate a time series that represented those deaths by taking the time series number of confirmed cases per day and scaling it down until the number of deaths it represented equaled a given percentage of the total official death tally.

I made this target percentage (the percentage of deaths in the official tally which are "spurious") a variable so that I could generate multiple time series of spurious (or coincidental) deaths per day corresponding to any target magnitude of this effect I wanted.

For each iteration of my run, I would generate the "spurious" deaths that would correspond to a given magnitude.  I then subtracted these deaths from the official tally.  The hypothesis of this particular run would be that the remaining deaths were the deaths caused "by" Covid, and should therefore match the Covid infection curve, but with a time delay.  I then scaled these deaths up to match the infection curve and found the best time delay which caused the death and infection curves to match.

By doing this for a target "spurious" death percentage of 0%, 10%, 25% and 50%, I figured I could see which rate of "deaths with" resulted in the best final match between time-shifted deaths and the original infections.  That is, the closer my arbitrary percent of "deaths with" ended up being to reality, the better the remaining deaths would correspond to the infections that actually caused them.

The result was as following (orange is scaled up deaths, blue is infections):


As you can clearly see, assuming that "deaths with" Covid account for either 0% or 10% of the total deaths results in a perfectly reasonable final death curve that matches the causal infection curve pretty nicely.  However, the further you increase this number above 10%, the worse the match becomes.

Periods of Rapid Infection Growth

The most telling part of these curves are the sections in which infections are increasing rapidly--primarily at the start of the Fall/Winter surge of 2020 and the current Summer surge of 2021.  The reason these diverge so strongly is that when you have infections very rapidly rising, you can start getting large differences between the infections and time-delayed deaths.  That is, you see large numbers of infections two weeks into one of these very rapid surges, whereas the deaths have not moved at all.  These time periods are extremely hard to explain using the "deaths with" hypothesis--if the infections are rising rapidly, why are coincidental deaths not also rising rapidly?  And you can see this divergence visually in my analysis by the big dips in the resulting death graph compared to infections during those periods.

You can see this problem already starting to emerge even in the 10% graph, as is clear in this blowup focusing in on the start of the Summer '21 surge:


That specific downward divergence problem only gets worse and worse as the hypothesized percentage of "spurious" deaths increase (as do other problems as well).  For this reason, I think that the 10% hypothesis has already slightly overshot the reality of how many coincidental deaths there actually are.  I would therefore put 10% as the upper cap on how much of the official death tally could be caused by purely coincidental deaths.

Another Important Factor: Amount of Time Shift

Another important thing to consider is how much the death graph had to be shifted back in time to match up with the infection graph.  Because removing spurious deaths takes deaths away from the left side of the death curve, in order to make the resulting curve match up with the infection curve, I had to increase the amount of time shift each time I increased the percentage of total deaths that I deemed spurious.

For the hypothesis that 0% of the total death tally is spurious, I had to shift the deaths back 20 days to get them to match up with the infections properly.  I had to increase this a few days for each subsequent graph, all the way up to 30 days of time shift or the graph where I assume 50% of the total death tally is spurious.

Here it is important to note that the average time-to-death from infection has been established independently based on case studies, and it's normally given at something in the range of 18 days.  This also argues against positing that the total percentage of spurious deaths goes very far above 0%--it's another way that the hypothesis results in unrealistic data the larger this percentage gets.

Some Closing Comments on this Analysis

1. Just to comment in case someone was confused: yes, there is a clear divergence between deaths and confirmed infections at the beginning of the graph.  This is a known issue caused completely by the fact that at the beginning of the pandemic we had very poor testing, meaning that the actual amount of Covid infection was far higher than what appeared by the number of confirmed Covid cases.  This hasn't been a problem since mid-last year.

2. One objection might be made, suppose there were other causes of overreporting aside from purely coincidental deaths?  This analysis doesn't rule those out per se, however given how well the time-shifted deaths matches the infections (when scaled), those causes of overreporting would have to be somehow time-matched to actual Covid deaths.  That is, the overreporting would get worse when *actual deaths from Covid* go up (not just Covid infections) and get better when these deaths go down.  I have not yet been able to think of a cause of overreporting that would be proportional to correct reporting in such a way.

3. Finally, I should note that this analysis will only catch overreporting of deaths due to coincidental Covid infections.  It would not catch any *underreporting* of Covid deaths.  Most causes of underreporting that you might think of would actually be time-matched with the actual deaths: for example, suppose elderly people with severe comorbidities who died of heart attacks due to stress on their system caused by Covid were sometimes thought to have died just from the heart attack, because it was known that their hearts were weak already.  In this case, a certain percentage of deaths actually caused by Covid could be put down as "just heart attacks" by whomever recorded their death. 

This could happen on a regular basis a certain percentage of time and it would not show up as an anomaly on this kind of a comparison graph, since the deaths are just scaled up to match with the infections anyway.  That would be one time-matched factor causing deaths to be *underreported*, and others could also be easily thought of.

This means that this particular analysis does not offer any sort of cap on how much the official death tally might be under-representing the actual death toll of Covid.  More on this point in Part 3.

Conclusion

The hypothesis that a significant portion of the official tally of Covid deaths are actually coincidental and result from some other cause is consistent with the timing of those deaths, but only if the total proportion of coincidental deaths is held at about 10% or below.  Meanwhile, the possibility that there might be signficant *undercounting* of Covid deaths for other reasons is still, at this stage, a possibility.

Dying "with" vs. Dying "from" Covid, pt. 1

You can still find people claiming, nowadays, that the official death toll from Covid is an overstatement of the actual deaths caused by Covid.  The rules for reporting deaths as "from" Covid, they say, are far too broad, and many people who are dying of other causes but simply happen to have Covid as well are being counted in Covid's official death toll.

There have been several serious flaws in this argument from the beginning, in my opinion.  First, proponents of this theory have frequently misread official guidelines for diagnosis or misapplied guidelines made at one level of government to local hospitals.  It's been a confusing set of changing guidelines, and unfortunately the tendency has been to jump on any rule change or guideline that supports this theory and publicize it widely, while ignoring rules or guidelines that don't.

Second, and more importantly, proponents of this theory have typically overemphasized the rules and down-played the common sense that actual humans writing death certificates bring to the table.  In my experience, there is quite a lot of interpretation according to common sense when it comes to the medical field.  Neither doctors nor nurses typically spend a lot of time robotically applying the exact written rules without regard for what they think is likely the right thing to do.  So I think it likely that common sense and good judgment is going to eliminate a lot of obviously wrong diagnosis.

Note that I am consistent in applying this principle.  At some point, the official rules for reporting adverse effects of a vaccination were updated to include guidelines specifically for Covid, and these rules are ridiculously strict--you are supposed to report any serious side effect after a Covid vaccination, whether you think it is linked to the vaccination or not ("regardless of causality", see text here: Reporting Adverse Events Following Vaccination).  This is explicitly different from the normal vaccination side effect reporting rules.  And yet I've never assumed that this rule has been followed completely, which--if it were--would imply that 100% of adverse side effects from the vaccines were being reported.  I believe the percentage is pretty high--but I also believe that despite the official rules, you will still get a lot of doctors applying common sense and saying, "no, I don't think that adverse effect is related" and not reporting something.  This, in my experience, is how the medical field operates most of the time.

However, I admit that these reasons are not super convincing.  Basically, how well you trust the numbers boils down to how much you trust the average hospital reporter to apply common sense.  And it's reasonable to have greater or less trust in these people, depending on your experiences and knowledge of the field.

So the question is, do we have any better, objective way of determining how often people's deaths are attributed to Covid purely because of coincidence?  And at this late stage in the pandemic, we do.  We now have a lot of data to work with and we can do some "forensic analysis" to get an idea of how often this happens.  We probably can't get a precise percentage, but we will be able to put some bounds of plausibility.

In Part 2 and Part 3, I will demonstrate two different ways of quantifying how often this kind of coincidental death occurs.